
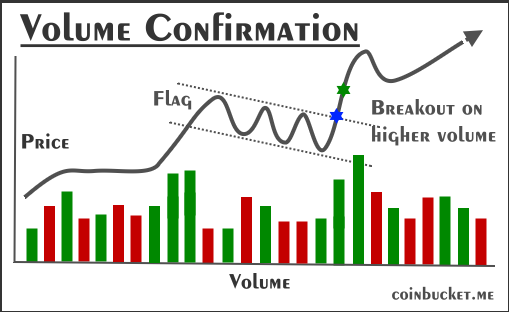
Volume confirmation—it’s that secret sauce that separates the real breakouts from the fake-outs that eat your stops alive. Think of it like crowd noise at a game: A quiet roar might be a dud, but when the stadium erupts? That’s the real play. In simple terms, it’s spotting a spike in trading volume (the number of shares traded) right when the price does something key, like busting out of a pattern we talked about. It screams, “Hey, the big players are piling in— this move’s got legs!”
Why It Matters for Your Setups
Volume indicators are like the unsung heroes of your chart—while price tells you what happened, volume spills the why and how strong. Without it, patterns like flags or triangles can trap you in a whipsaw (quick fake move back the other way). High volume confirms conviction—more buyers (or sellers) jumping aboard means the trend’s fueled up, not just random noise. Backtests show confirmed breaks hit 10-20% higher win rates vs. low-volume ones. Low volume? Often, a head-fake from low-liquidity traps.
How to Spot and Use Volume Confirmation (Step-by-Step)
- Baseline Check: On your chart, add a volume indicator below the price bars. Eyeball the average over 10-20 periods— that’s your “normal” hum.
- The Spike Rule: For a breakout (e.g., bull flag, continuation wedge, ascending triangle, etc.), wait for volume to jump 50-100%+ above that average. Green bars exploding up? Bulls are charging.
- Entry Tweak: Only pull the trigger if the price closes beyond the pattern line on that volume pop. No spike? Sit tight—patience saves commissions.
- Exit Hint: Fading volume on the ride higher? Consider trailing your stop tighter; it’s a whisper that the momentum’s cooling.
Pro tip:
Pair a volume indicator with RSI >50 for extra juice on momentum plays. Try it out on paper trades first.
Quick example with our bullish flag: Price consolidates after a rally, then pokes above the upper trendline. If volume’s meh (below avg), it’s probably a trap—bail or wait. But if it’s roaring 2x normal? Boom, long with a target at the pole’s length. Here’s a dead-simple visual breakdown (volume bars at bottom—spike = go time):
| Phase | Price Action | Volume Vibe | Your Move |
|---|---|---|---|
| Pole (Initial Rally) | Sharp up-move | Building/avg | Watchlist it |
| Flag (Consolidation) | Sideways pullback | Dropping/low | Chill, no trade |
| Breakout | Above flag high | Spike! (1.5x+ avg) | Enter long |
| False Break | Above but reverses | Flat/low | Avoid or cut quick |
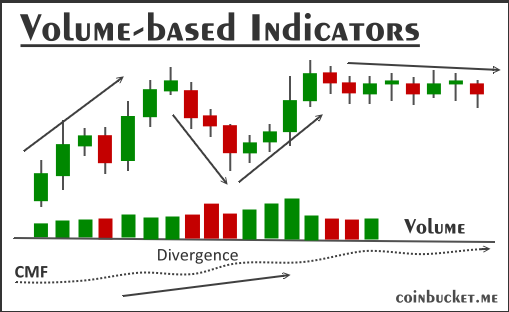
Volume-based Indicators add Volume Confirmation Layers
A volume spike alone is good, but indicators add layers—like divergence warnings (price up, volume down? Red flag) or flow tracking (buyers piling in?). From fresh 2025 scans, here are the top performers that actually move the needle without overwhelming your setup. We picked four battle-tested ones—OBV for trends, and a few flow trackers.
On-Balance Volume (OBV)
What it does
Adds volume on up days, subtracts on down days—builds a running tally of “smart money” flow. Rising OBV with flat price? Hidden strength brewing.
Best for
Trend confirmation & divergences in stocks/ETFs. ~70% edge on breakouts.
Pro Tip / Watch out
Pair with MA for crossovers; lags in chop.
Example Signal
Price stalls but OBV climbs—buy the dip before the pop.
Accumulation/Distribution (A/D Line)
What it does
Tracks close location in the day’s range x volume—positive if closing high (accumulation), negative low (distribution).
Best for
Spotting supply/demand shifts in volatile names like tech.
Pro Tip / Watch out
Great for reversals; noisy on low-float stocks.
Example Signal
A/D rising while price dips—accumulation loading, time to buy.
Chaikin Money Flow (CMF)
What it does
Sums A/D over 20 periods—above 0 = buying pressure, below = selling. Oscillates like RSI but volume-weighted.
Best for
Momentum fades or builds; it works on any timeframe.
Pro Tip / Watch out
Thresholds at ±0.05; divergences shine.
Example Signal
CMF >0.05 during uptrend—hold or add; cross below? Trail stops.
Money Flow Index (MFI)
What it does
RSI’s volume cousin (0-100 scale)—over 80 overbought, under 20 oversold, but factors volume for “true” strength.
Best for
Overbought/oversold calls in ranging markets.
Pro Tip / Watch out
Like RSI, avoid strong trends; tweak to 14-period.
Example Signal
MFI <20 + volume uptick—oversold bounce incoming.
Last word:
These aren’t set-it-and-forget-it bots, but layer one (say, OBV) on your patterns from before—like a flag breakout only if OBV’s trending up. Start with the defaults on a demo account; tweak the periods to your style (shorter for scalps, longer for swings).
Pro move:
Scan for divergences weekly—saved my bacon more times than I can count.
Leave a Reply
You must be logged in to post a comment.