810 words, 4 minutes read time.
Chasing those clean trends and momentum bursts without overcomplicating life? Smart move—chart patterns are like your trusty sidekick for spotting high-probability setups. Based on solid backtested data from trading pros, the MVPs for us retail folks in trending markets are continuation patterns like flags and triangles, which nail 65-75% win rates when volume confirms the breakout (no holy grail, but way better than flipping coins).
We’ll break down four battle-tested ones: two pure trend chasers and two momentum boosters. Kept them simple so you can spot them on your platform without a magnifying glass.
Short sellers love their bearish inverse variations. But we are not short sellers. We do not buy; instead, we consider selling when confronted with bearish chart patterns.
These bullish ones shine in uptrends (flip for bears), but always pair with volume spikes and a stop order below the pattern low. Risk 1% per trade, and let winners run. Ready for visuals? I whipped up clean, labeled sketches for each—think TradingView-style but trader-friendly.
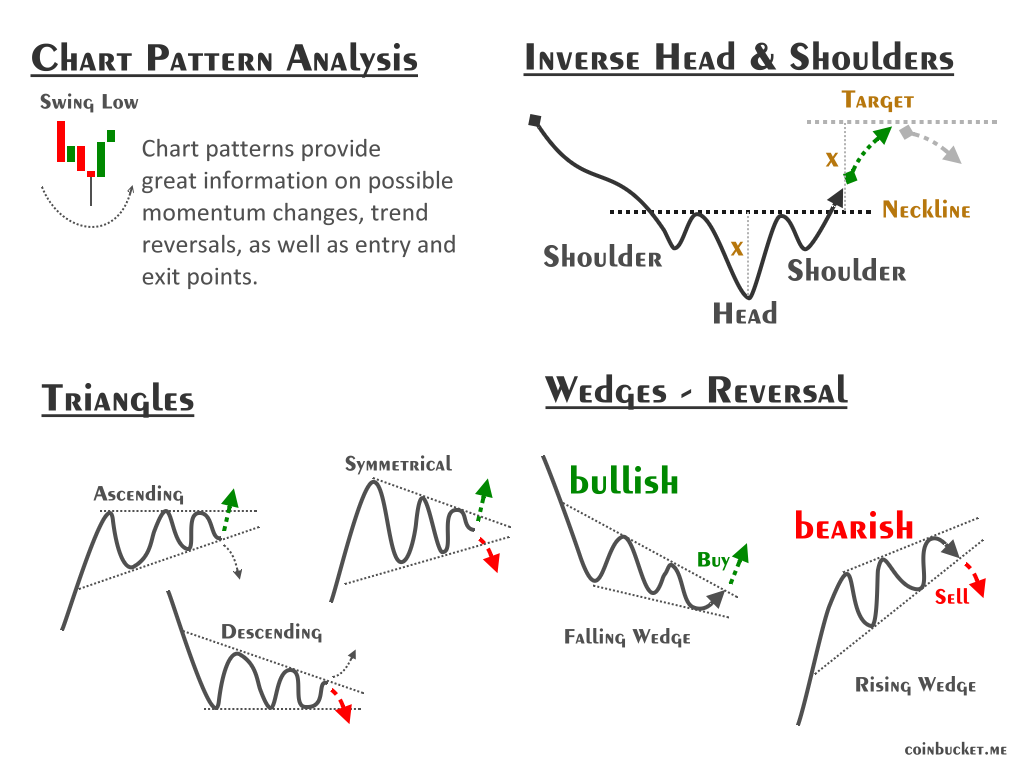
1. Bullish & Bearish Flags and their Likes
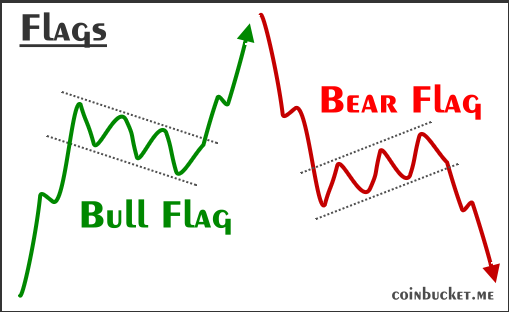
A bullish flag, the trend continuation king, forms after a sharp rally (the “pole”) followed by a tight sideways pullback (the “flag”) on light volume—like the market catching its breath before blasting higher. Enter long on the upside breakout above the flag’s high, target the pole’s length added to the breakout.
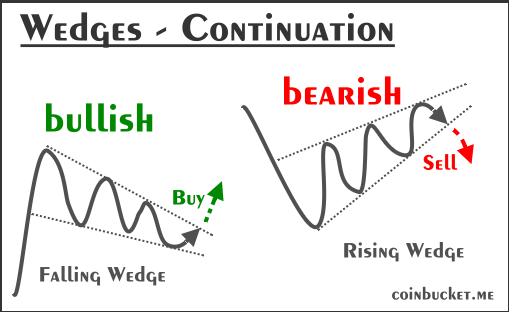
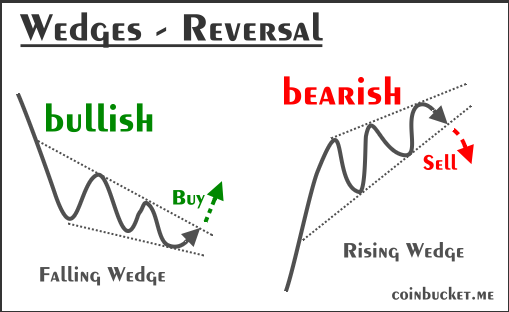
Wedges are a variation of flags. Some hint at a continuation of the trend, up or down.
Others hint at a reversal, up or down.
Why bullish flags and wedges rock: Catches momentum without fighting the tape; backtests show ~70% success in bull runs.
2. Ascending Triangle and Less Likelies
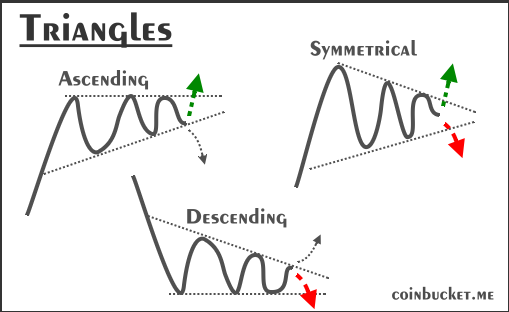
Picture higher lows bouncing off a flat resistance line—like stairs climbing to a door that finally swings open. The ascending triangle, a breakout momentum magnet, is a bull’s way of building steam for an upside explosion.
Buy the breakout above resistance with rising volume; the target equals the triangle’s height projected up. Killer for momentum: ~68% hit rate on stocks like tech names in uptrends, per pattern studies.
3. Cup and Handle (Steady Trend Builder)
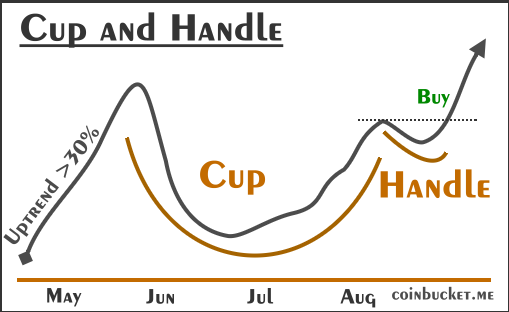
The “cup” is a rounded U-shaped dip and recovery (patience test), then a little flag-like “handle” shakeout. Enter on handle breakout; target the cup’s depth added to the rim. It’s gold for longer swings—reliable ~65% in established uptrends, loves dividend payers or blue chips.
4. Inverse Head and Shoulders (Momentum Reversal to Trend)
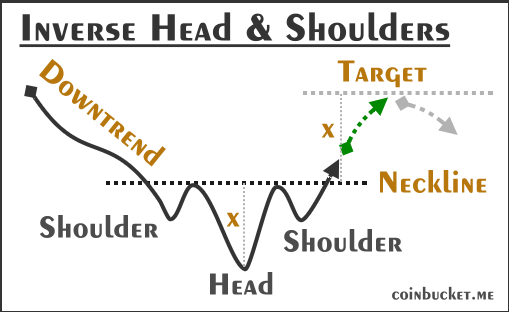
Three troughs: shallow left shoulder, deeper “head,” shallow right shoulder, with a neckline overhead. The right shoulder signals weakening sellers—buy the neckline breakout for a fresh uptrend kickoff. Momentum fave: ~72% accuracy flipping bears to bulls, especially post-correction.
Paper trade these on your watchlist first—markets love faking you out if you’re impatient.
Chart Patterns Of Trouble
Unless you are a short seller, be wary of these chart patterns.
Even if you’re strictly long-only like most of us retail momentum hunters, spotting these bearish patterns is your early-warning radar for dodging drawdowns and protecting those hard-earned gains. They pop up as topping signals or downtrend continuations, screaming “time to tighten stops, trim positions, or sit on the sidelines” before the rug gets pulled.
Just like the bull setups we covered, they boast 60-75% reliability in backtests when volume backs the breakdown (spike on the drop, fade on bounces)—no fortune-telling required, but they’re lifesavers in choppy or overextended markets like 2025’s swings.
I cherry-picked four high-conviction ones from solid sources: two continuations that warn of deeper pullbacks in weakening trends, and two reversals that flag the end of up-legs. Watch for ’em on your longs—breakdown below key levels? Bail or hedge quickly, with stops above the pattern high. Volume is your bullshit detector: Low on the drop? Might be a fake-out bounce brewing.
1. Bearish Flag (Downtrend Continuation Crusher)
Forms after a sharp drop (the “pole”) with a tight upward-sloping consolidation (the “flag”) on drying volume—like bears reloading before the next leg lower. Rocks for momentum.
2. Descending Triangle (Bearish Breakdown Beast)
Lower highs hitting a flat support line—like a ramp sliding to a trapdoor. Sellers grind resistance down until support cracks.
3. Head and Shoulders Top (Reversal Trend Killer)
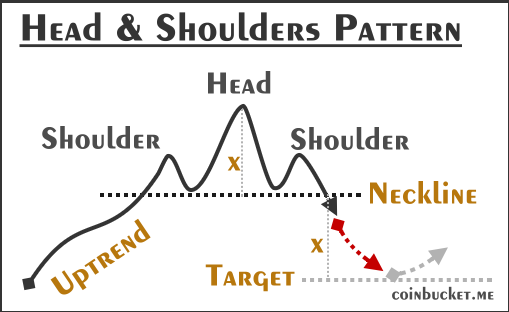
Classic topper: Left shoulder peak, higher head peak, right shoulder peak, neckline below connecting troughs. Right shoulder shows fading bulls—short neckline break. Reliable for swings: High ~72% reversal rate, especially post-rally.
4. Double Top (M-Shape Momentum Trap)
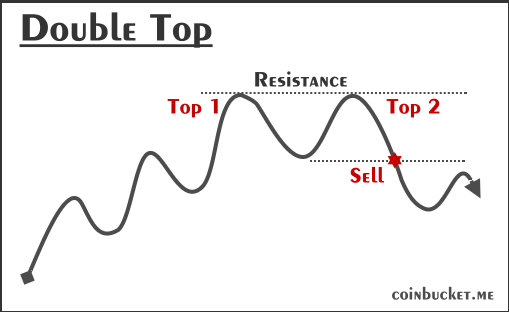
Two peaks at resistance with a trough in between—like bulls twice failing the summit. Breakdown below trough support confirms exhaustion. Solid for trends: High ~65% in uptrend tops.
These bullish chart patterns shine in uptrends (flip for bears), but always pair with volume spikes and a stop order below the pattern low. Also, take a look at our 2 dead-simple algos to fill your coin bucket.
3 responses to “Getting started with Chart Patterns: Spot High-Probability Setups And Dodge the Traps”
[…] of market moods without fancy AI—mix ’em for diversification. Also, add considerations of chart patterns for spotting high-probability setups to the mix. And don’t forget to place a stop-loss order under your investments to keep your […]
[…] without FOMO and burnout. Pair it with good basics—like having a simple plan, knowing when to buy and when to walk away, managing your trade sizes, and using stop orders—and you’ll feel more in […]
[…] price tells you what happened, volume spills the why and how strong. Without it, patterns like flags or triangles can trap you in a whipsaw (quick fake move back the other way). High volume confirms […]