1,178 words, 6 minutes read time.
Chasing those trends and momentum swings like the rest of us? If you’re just dipping your toes into technical analysis, candlesticks are your new best friend. They’re basically visual snapshots of price action over a specific time period (like a day or even an hour on your chart).
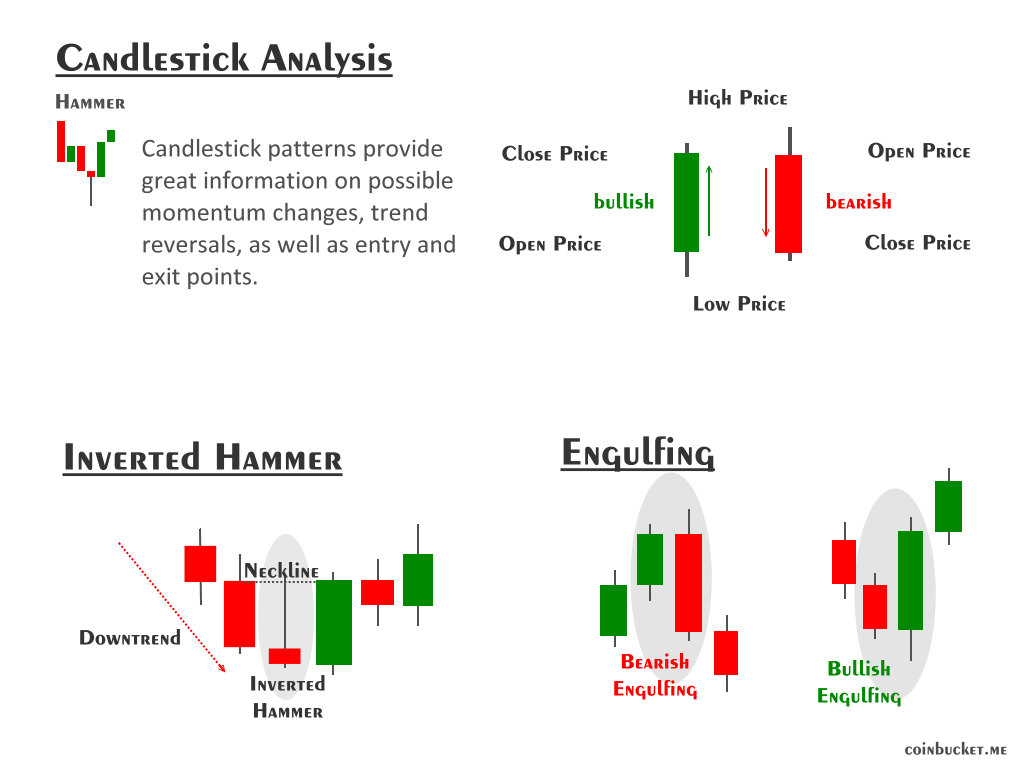
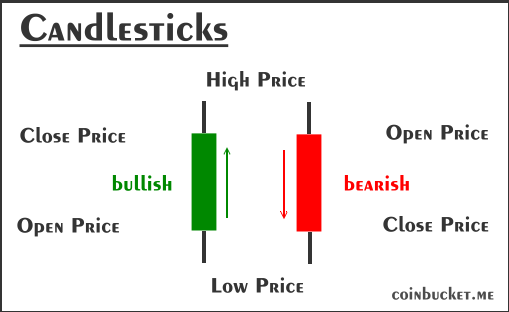
Each “candle” shows four key things: the open price (where it started), the close price (where it ended), the high (the peak during the period), and the low (the bottom).
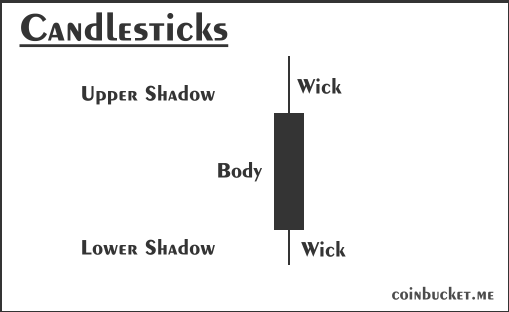
The body of the candle (that fat rectangle) is colored green (or white) if it closed higher than it opened—bulls are winning. Red (or black) if it closed lower—bears are in charge. Those thin lines sticking out? They are wicks or shadows, showing the highs and lows where price poked around but didn’t stick.
Why do we care as trend/momentum traders? Candlesticks reveal the battle between buyers and sellers in real-time, helping you spot reversals or continuations before the herd piles in. They’re not magic (nothing is), but paired with your trendlines or RSI, they crank up your edge.
If you’re like me—grinding through day charts on my trading platform, hunting for that next momentum pop or trend continuation—you know the drill. One wrong entry, and poof, your account’s nursing a bruise. Enter candlestick patterns: those little chart warriors that scream “buy here!” or “run for the hills!” But not all are created equal. Some are high-probability gold for jumping into trends with conviction, while others are sneaky traps that lure you in to slap you down.
As a beginner in trend and momentum trading, focus on patterns that align with the bigger picture—like a hammer at support in an uptrend. I’ll break down the most prominent ones: the setups to chase (with entry tips) and the duds to sidestep. No fluff, just actionable stuff. Let’s light those candles.
The Basics: Why Candlesticks Matter for Us Retail Folks
Before we dive in, a quick reality check: Candlesticks aren’t standalone crystal balls. They’re clues from the price action battlefield. Use them on liquid assets like stocks during your trading hours, and always confirm with volume or a simple moving average. Green body? Bulls are pushing up. Red? Bears are dragging down. Wicks show rejection—like price testing a level and bouncing back.
Candlestick patterns fall broadly into three categories:
- bullish (reversal or continuation of upward moves)
- bearish (reversal or continuation of downward moves)
- neutral (indecision or transition signals).
Ready? Here’s the lineup.
Bullish: Your Go-To Setups for Trend Entries
These good boys have a solid track record (backtests show 60-70% win rates in trending markets when confirmed). Some appear a bit alike. Look for them at key support levels, moving-average crossovers, or during a corrective drop. Enter on the next candle’s break, with a stop below/above the pattern’s low/high.
1. Bullish Engulfing:
The Momentum Reversal King
Spot this after a downtrend—it’s like the bears are exhausted, and bulls charge in for the kill. A small red candle followed by a bigger green one that completely “engulfs” the prior body’s range. Shows intense buying pressure overtaking sellers and signals a high-probability buy for trend resumption.
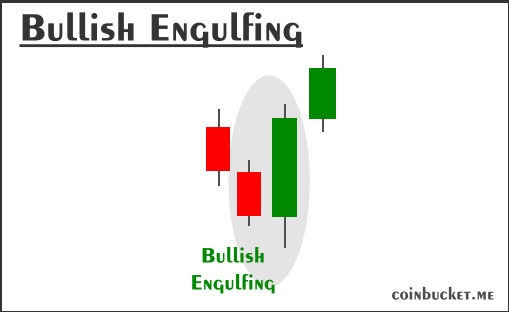
Trade it: Best when forming at key support levels. Buy above the engulfing high, target the next resistance. High probability in oversold momentum (RSI <30).
2. Hammers & Stars:
The Bottom-Pin Reversal Hammer
After a pullback in an uptrend, this single-candle gem shows up with a small body at the top and a long lower wick (twice the body size). Price dipped low, but buyers hammered it back up—rejection of lows. Shows buyers rejected lower prices.
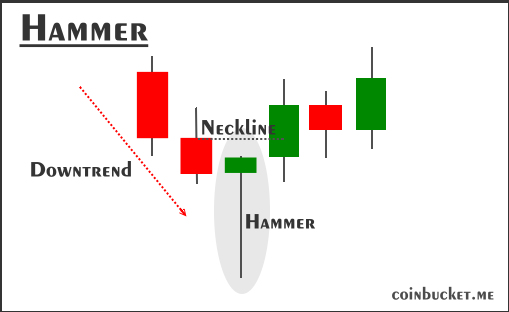
Trade it: Long above the high, especially if volume spikes. Killer for momentum bounces off support.
Three-Candle Dawn of a Bull Trend
A bearish candle, followed by an inverted hammer, then a strong green closer. It’s a multi-day reversal signaling the end of a downtrend—ideal for longer momentum swings.
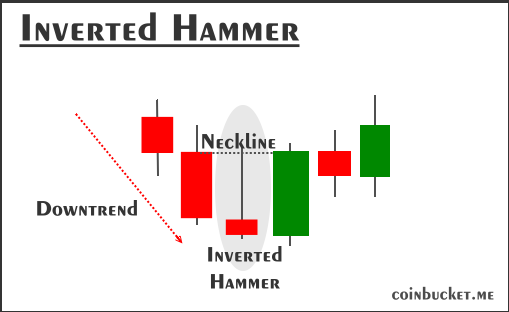
Trade it: Long above the green high, especially if volume spikes. Killer for momentum bounces off support.
Similar to the Hammer is the Morning Star formation, which features a doji/spinning “star” (indecision) instead of a hammer. Always look for confirmation via green follow-up candle(s) accompanied by volume expansion.
Neutral: The Sneaky Traps That Burn Retail Accounts
Not every pretty pattern pays. These look promising but often fake out in choppy or low-volume markets. Skip them solo—wait for confluence or bail fast. They’re high-failure (under 40% without confirmation) because they scream indecision or trap the impatient.
1. Doji: The Indecision Tease
A cross-like candle where open and close are nearly equal—buyers and sellers in a standoff. In trends, it might hint at a reversal, but standalone? It’s a coin flip. Dodge jumping in without the next candle confirming direction.
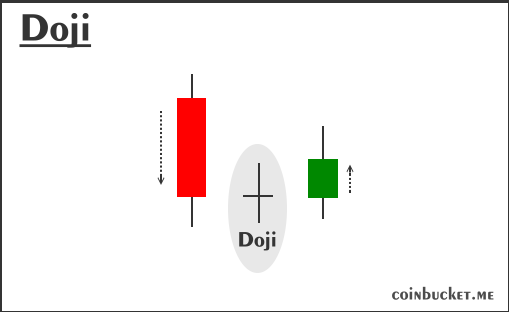
Why avoid: Fakes out 70% of the time in ranging markets. Use it as a pause button, not a trigger.
2. Hanging Man: The False Topper
Looks like a hammer but at an uptrend peak—small body, long lower wick. Sounds bearish, right? But without a confirming red candle after, it’s often just profit-taking noise, not necessarily a reversal.
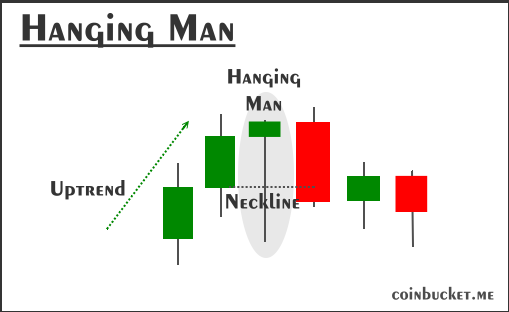
Why dodge: Possible but not necessary bearish reversal. Tighten a sell trailing stop or sell if the next bar closes lower and volume drops.
Bearish: The Reds That Make You Hold Your Purse Tight
These bad boys look like the reversals of the good boys. Again, some appear a bit alike. Look for them at key resistance levels, moving-average crossovers, or after a long momentum run. Sell on the next candle’s break.
1. Bearish Engulfing Pattern
Mirror image of the bullish one, but at the top of an uptrend. Stronger at resistance levels. Small green candle, then a monster red one engulfs it. Short traders love this for fading overbought rips (RSI >70), but we are not short sellers.
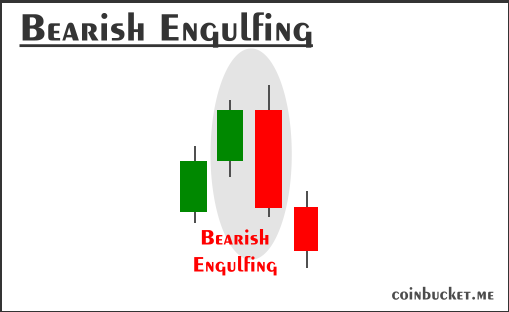
Trade it: Sell below the engulfing low. If not too late, tighten the trailing stop on the downtrend.
2. Shooting or Evening Star:
The Bearish Sunset on Uptrends
Opposite of morning star: Bullish candle, inverted hammer or indecision doji, then bearish closer. Watch for this at resistance to catch the momentum stall.
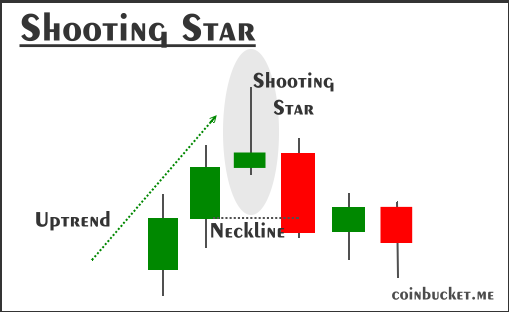
Trade it: Sell the third candle, target prior support.
Again, not every pretty pattern pays you, as some pay other traders. These look hideous and often cost you money. Skip them solo or bail fast. They’re high-failure (under 40% without confirmation) because they scream reversal and trap the unwary.
Trade it: Sell on the third candle’s close, stop below the middle low.
Wrapping It Up: Build Your Edge, One Candle at a Time
There you have it—your starter kit for candlestick mastery. Chase the engulfings and stars in strong trends for those high-prob entries that keep your win rate humming. And yeah, dodge the dojis and hanging men unless they’ve got backup from your momentum indicators. Remember, retail trading’s a marathon: Paper trade these on a demo first, risk 1% per setup, and journal what works.
Leave a Reply
You must be logged in to post a comment.